In the realm of aerospace and robotics engineering, understanding the forces generated by a rotating propeller is fundamental to designing stable and efficient aerial vehicles. Whether it’s a multi-rotor drone, a vertical take-off and landing (VTOL) aircraft, or a laboratory-scale helicopter model, the ability to accurately measure and model propeller thrust is a critical skill for any control systems engineer.
Thrust is the primary force that counteracts gravity and provides maneuverability, and its precise characterization is the cornerstone of effective flight control design.
This comprehensive guide explores the intricacies of propeller thrust measurement, from the underlying physical principles to advanced mathematical modeling and practical laboratory experiment design. We will delve into the differences between static and dynamic thrust, walk through the process of developing a thrust-RPM model, and provide a step-by-step procedure for conducting your own thrust measurement experiments. This article is tailored for control systems academics, lab coordinators, and R&D engineers seeking to deepen their technical understanding of propeller rotor dynamics.
What Is Thrust and Why Does It Matter in Propeller Systems?
Thrust is a reaction force described by Newton’s Second and Third Laws. When a propeller spins, it accelerates a mass of air in one direction; in response, an equal and opposite force—thrust—is exerted on the rotor assembly in the opposite direction. In a typical propeller-based system, this force is what allows the vehicle to lift off, hover, and change altitude.
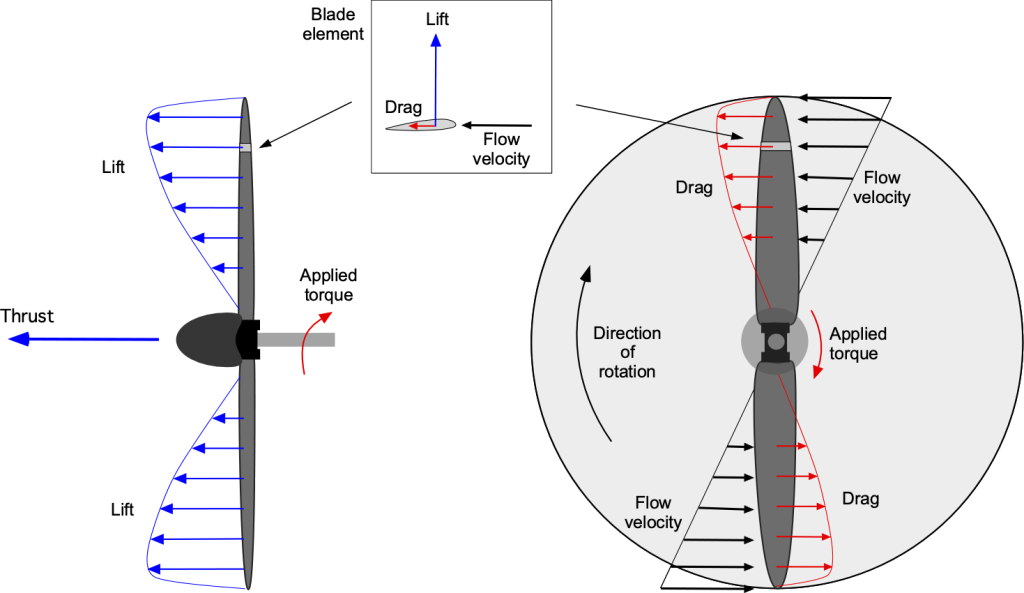
From the control systems design perspective, thrust is often the primary control input. However, thrust is not something we either measure or control directly; instead, we control the voltage or PWM signal sent to a DC motor, which in turn determines the rotor’s rotational speed (RPM). The amount of generated thrust is modulated by the RPM of the DC motor primarily.
To design an effective controller, we must have a reliable mathematical model that relates these electrical inputs to the resulting mechanical thrust force. Without an accurate thrust force modeling approach, controllers may suffer from poor tracking, instability, or unexpected behavior during maneuvers.
Static vs. Dynamic Thrust Measurement
When characterizing a propeller, engineers distinguish between two primary conditions:
- Static Thrust: This is the thrust produced when the rotor is spinning but the entire assembly is stationary relative to the surrounding air (zero airspeed). Static thrust tests are the standard for initial motor and propeller characterization in a lab setting.
- Dynamic Thrust: This is the thrust produced when the vehicle is moving through the air. As the inflow velocity changes, the effective angle of attack of the propeller blades also changes, typically leading to a decrease in thrust for a given RPM as forward speed increases. The dynamic thrust tests are more difficult to run in a lab environment, requiring either the vehicle operational in the air or the motor and propeller placed inside a wind tunnel.
For most laboratory experiments and initial control design phases, static thrust test data provides the necessary foundation. It allows engineers to establish the baseline performance of the propulsion system before accounting for the added complexities of flight dynamics.
Thrust Force Modeling
The relationship between a propeller’s angular velocity () and the thrust (T) is non-linear. In its simplest and most widely used form, thrust is proportional to the square of the angular velocity:
where: T is the thrust force (typically in Newtons). w is the angular velocity (radians per second), k is the thrust coefficient propeller constant, which depends on air density, propeller diameter, and blade geometry.
Identifying the value of k is a primary goal of propeller characterization. Below is a MATLAB thrust modeling example showing how to implement this relationship and visualize the thrust curve based on experimental data.
% MATLAB Implementation of T = k*w^2 Thrust Model
% Define the thrust coefficient (identified from experimental data)
k = 2.5e-6; % Example value: N / (rad/s)^2

% Define a range of angular velocities (rad/s)
omega = 0:10:600;

% Calculate thrust based on the model
thrust = k * (omega.^2);

% Plotting the results
figure;
plot(omega, thrust, 'LineWidth', 2);
grid on;
xlabel('Angular Velocity (rad/s)');
ylabel('Thrust Force (N)');
title('propeller Thrust vs. Angular Velocity Model');
Understanding this quadratic relationship is essential for “linearizing” the control system, allowing engineers to use linear control techniques like PID or LQR on what is inherently a non-linear propulsion system.
Thrust Measurement in the Lab
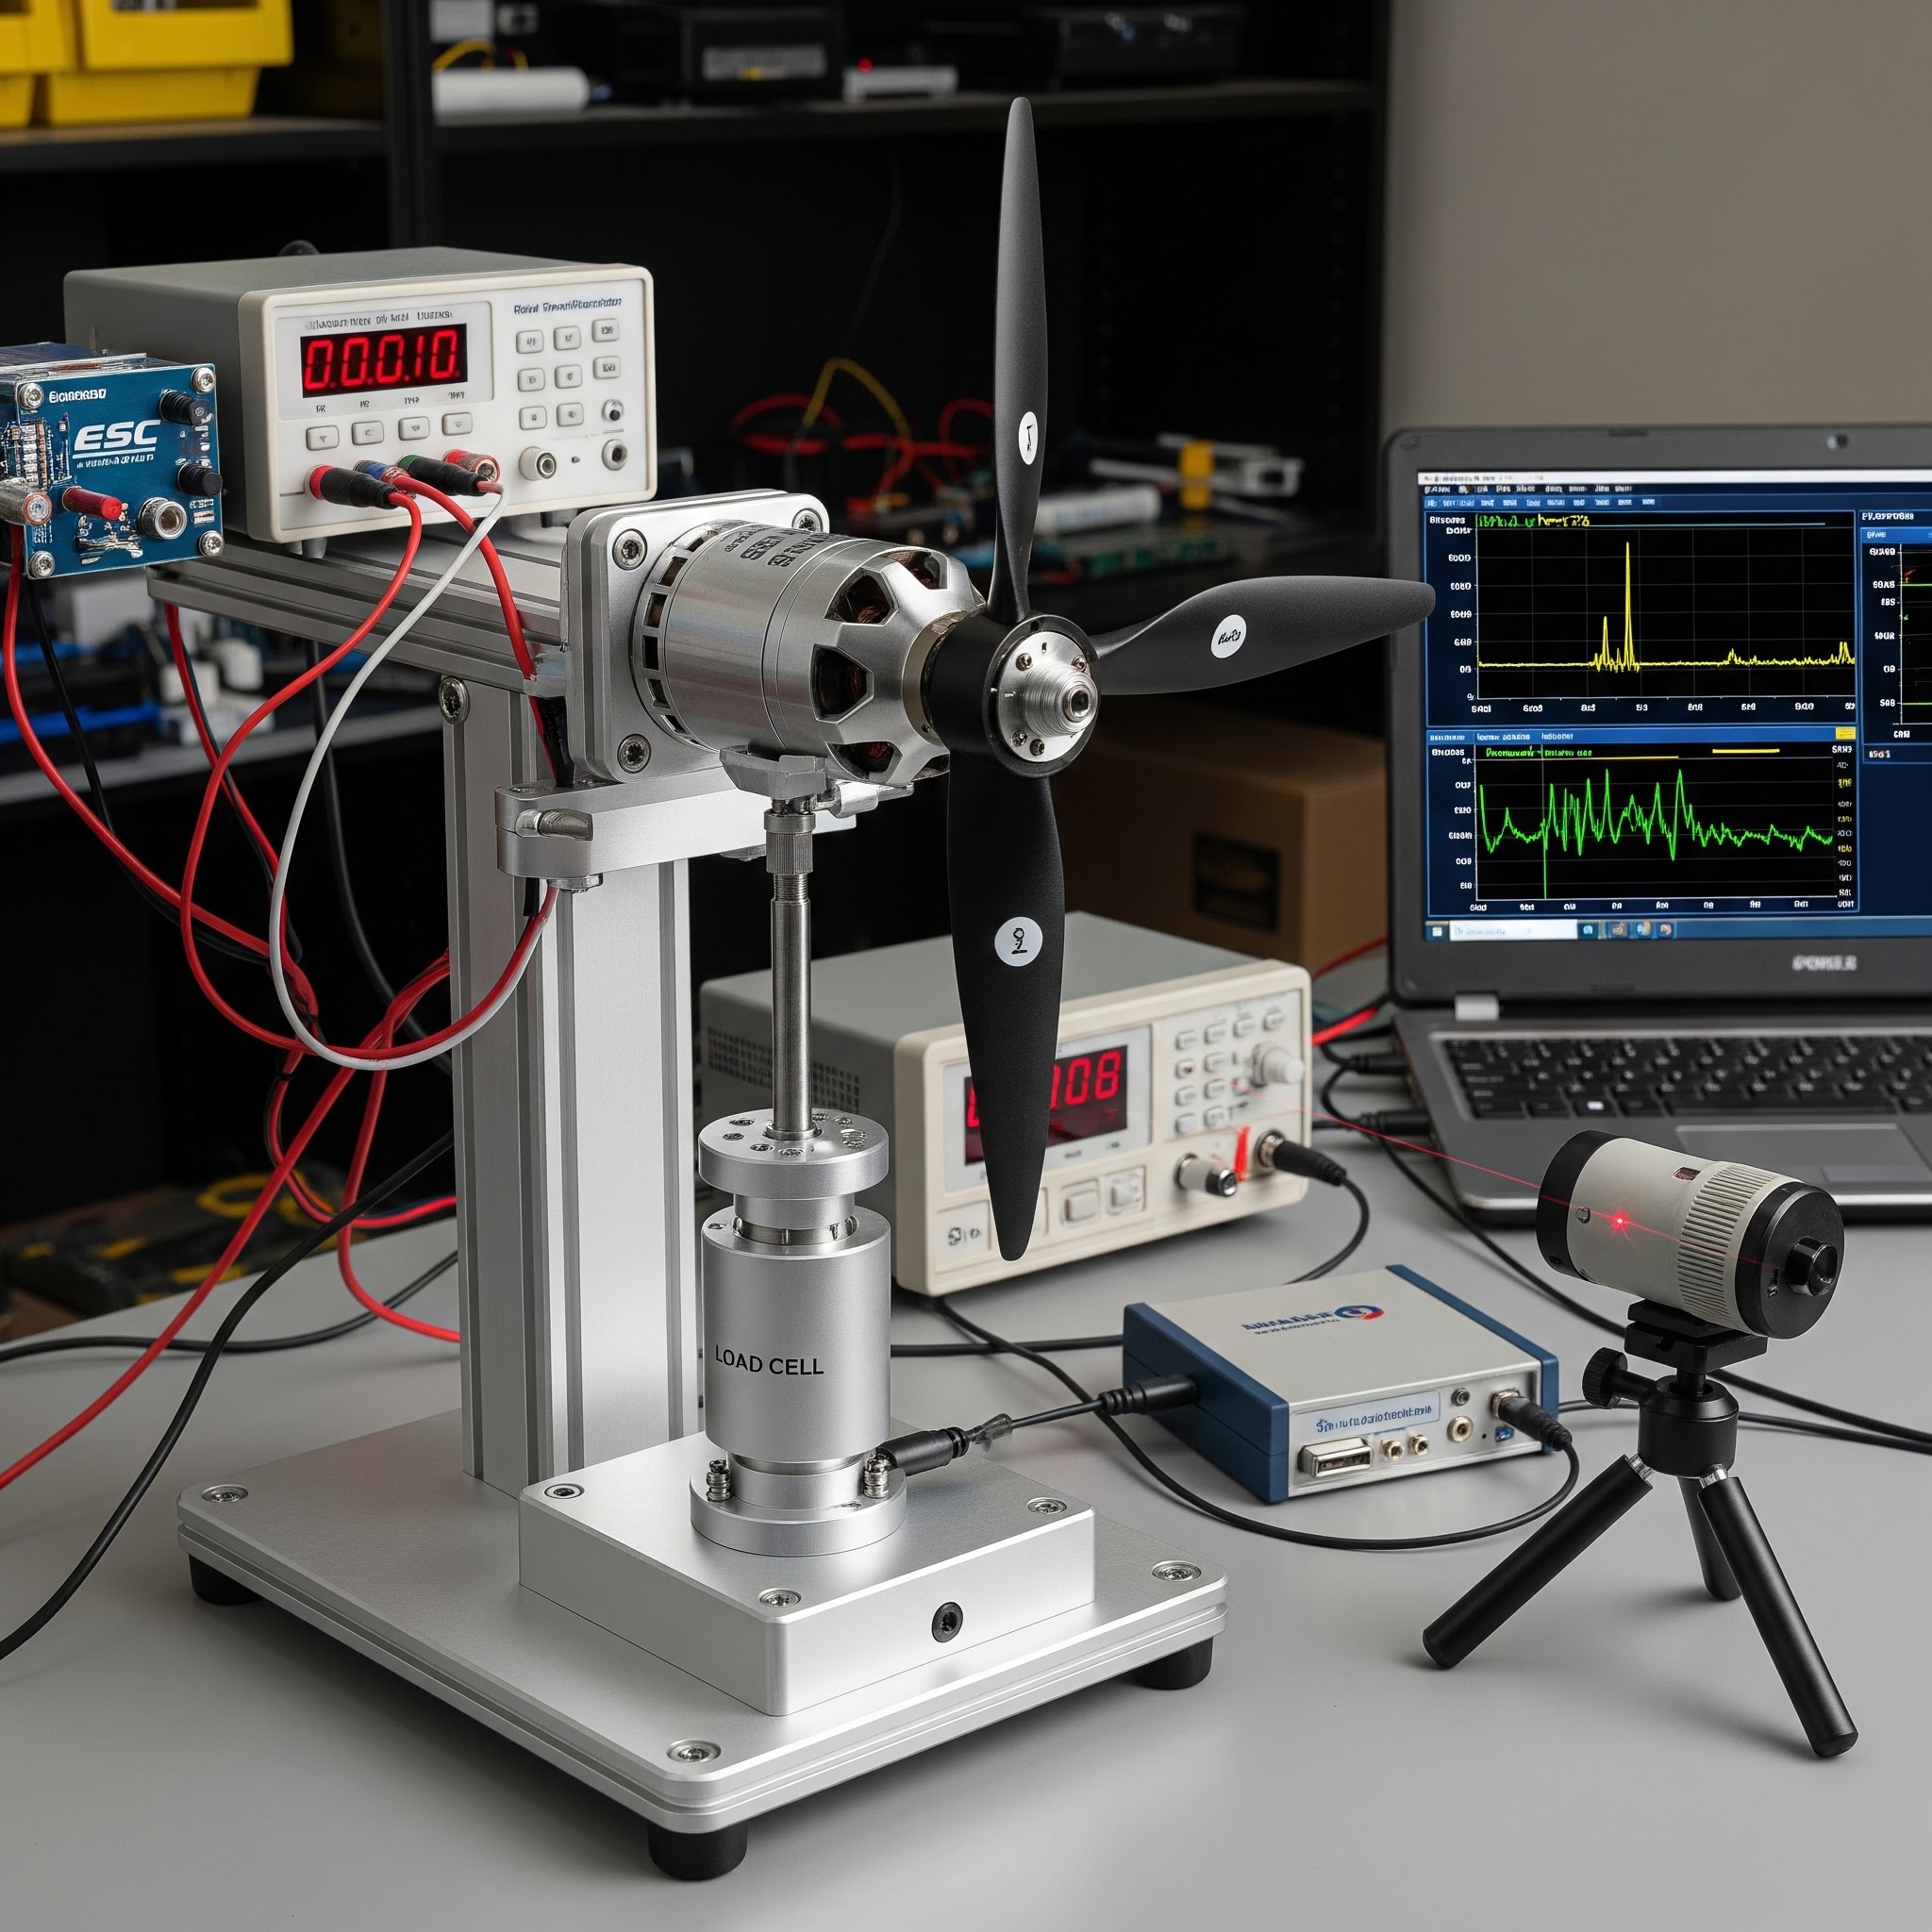
Conducting a motor thrust experiment requires a specialized setup, often involving a load cell or a calibrated balance to measure the force, and a tachometer to measure the RPM.
Recommended Equipment
- DC motor thrust assembly (Brushless or Brushed).
- Electronic Speed Controller (ESC) and a power supply.
- Propeller of known diameter and pitch.
- Load cell (force sensor) with a data acquisition system.
- Optical or Hall-effect tachometer for thrust vs RPM measurement
Step-by-Step Experiment Procedure
- Safety Check: Ensure the thrust stand is securely mounted to a heavy base. Clear the area of any loose objects and ensure all personnel are wearing safety glasses.
- Calibration: Calibrate the load cell using known weights to ensure the force readings are accurate in Newtons.
- Zeroing: With the motor off, tare the load cell to account for the weight of the motor and propeller assembly.
- Data Collection: Gradually increase the motor voltage/throttle in fixed increments (e.g., 10% steps). At each step, allow the system to reach a steady state and record both the RPM and the measured thrust.
- Repeatability: Conduct at least three runs to ensure data consistency and average the results.
- Analysis: Use the collected data to perform a least-squares fit to determine the thrust coefficient k for your specific motor-propeller combination.
Thrust-RPM Relationship (Sample Data)
As shown in the table, as the RPM increases from 1000 to 5000, the thrust increases significantly from approximately 0.03N to nearly 0.7N, following the expected quadratic trend.
Thrust Measurement with the Acrome 3-DoF Copter
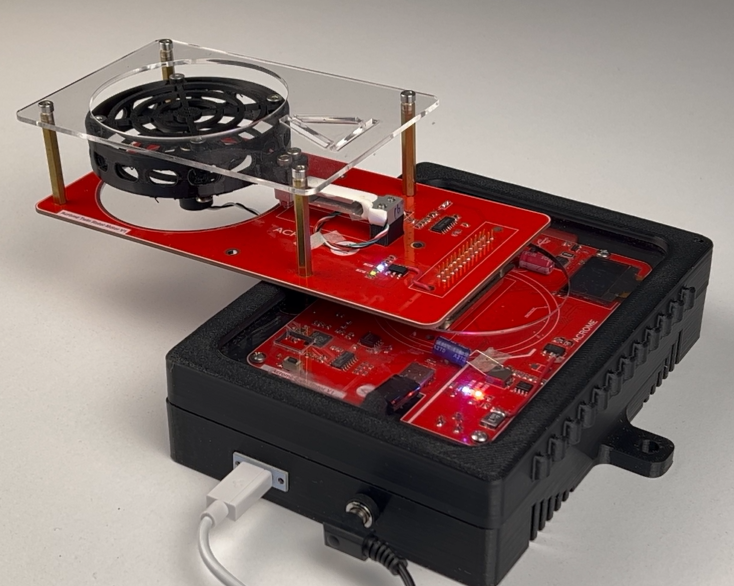
While building a custom thrust stand is a great exercise, many labs prefer integrated solutions that allow for immediate experimentation. The 3-DoF Copter by Acrome is a perfect example of a lab-ready platform designed specifically for these types of studies.
The 3-DoF Copter features built-in sensors that allow students to measure the thrust produced by its twin rotors in real-time. This eliminates the need for external load cells and complex mounting hardware, allowing researchers to focus directly on the propeller thrust measurement and control design aspects.
Run this experiment on real hardware! Explore the 3-DoF Copter — Acrome’s lab-ready twin rotor platform with built-in thrust measurement capabilities, perfect for control systems education and research.
Common Errors and How to Avoid Them
When performing a thrust measurement lab session, several factors can introduce errors:
- Ground Effect: If the propeller is too close to the floor or a table, the recirculating air can artificially increase the thrust reading. Ensure at least 2-3 propeller diameters of clearance in all directions.
- Vibrations: Unbalanced propellers can cause significant vibrations that interfere with load cell readings. Always balance your propellers before testing.
- Voltage Sag: As the motor draws more current at high RPM, the power supply voltage might drop, leading to inconsistent results. Use a regulated power supply capable of handling the peak current.
- Air Density: Remember that k is dependent on air density. If you are conducting experiments at high altitudes or in very hot/cold environments, your results will differ from sea-level standards.
Conclusion
Mastering propeller thrust measurement is a vital step in the journey of a control systems engineer. By understanding the quadratic relationship between RPM and thrust, and by conducting careful, calibrated experiments, you can develop the accurate models necessary for high-performance flight control. Whether you are using a custom-built rig or a sophisticated platform like the Acrome 3-DoF Copter, the principles of characterization remain the same: measure precisely, model accurately, and validate thoroughly.
Frequently Asked Questions (FAQ)
1. Why is thrust proportional to the square of the RPM? This relationship comes from fluid dynamics. The force produced by a propeller is related to the pressure difference it creates and the mass flow rate of air, both of which are functions of the rotor’s rotational speed.
2. Can I use the same thrust model for different propellers? No. The thrust coefficient k is highly dependent on the propeller’s diameter, pitch, and blade shape. Even a small change in propeller geometry requires a new characterization experiment.
3. What is the difference between a brushless motor and a DC motor for thrust experiments? While the underlying thrust principles are the same, brushless motor thrust systems are generally more efficient and capable of higher RPMs, whereas traditional brushed DC motors are simpler to control but may have more friction and lower power density.
4. How does air density affect my thrust model? Thrust is directly proportional to air density (). If you move your experiment from a sea-level lab to a high-altitude location, the thrust produced at the same RPM will decrease.
5. What is the most accurate way to measure RPM? Optical tachometers are generally preferred as they do not add any mechanical load to the motor. Many modern ESCs also provide “telemetry” data that includes the motor’s electrical RPM, which can be converted to mechanical RPM.
Author


